How to: Create a dynamic updating table for your timeline
Learn how to create a dynamic updating table in your ChronoFlo timeline using spatials and graphs.
1st May 2026 | Timeline Editors
If you’ve explored some of the richer examples on ChronoFlo Timeline Maker, you may have noticed that timelines don’t just have to display events. They can also tell a story through numbers—quietly updating in the background as time moves forward.
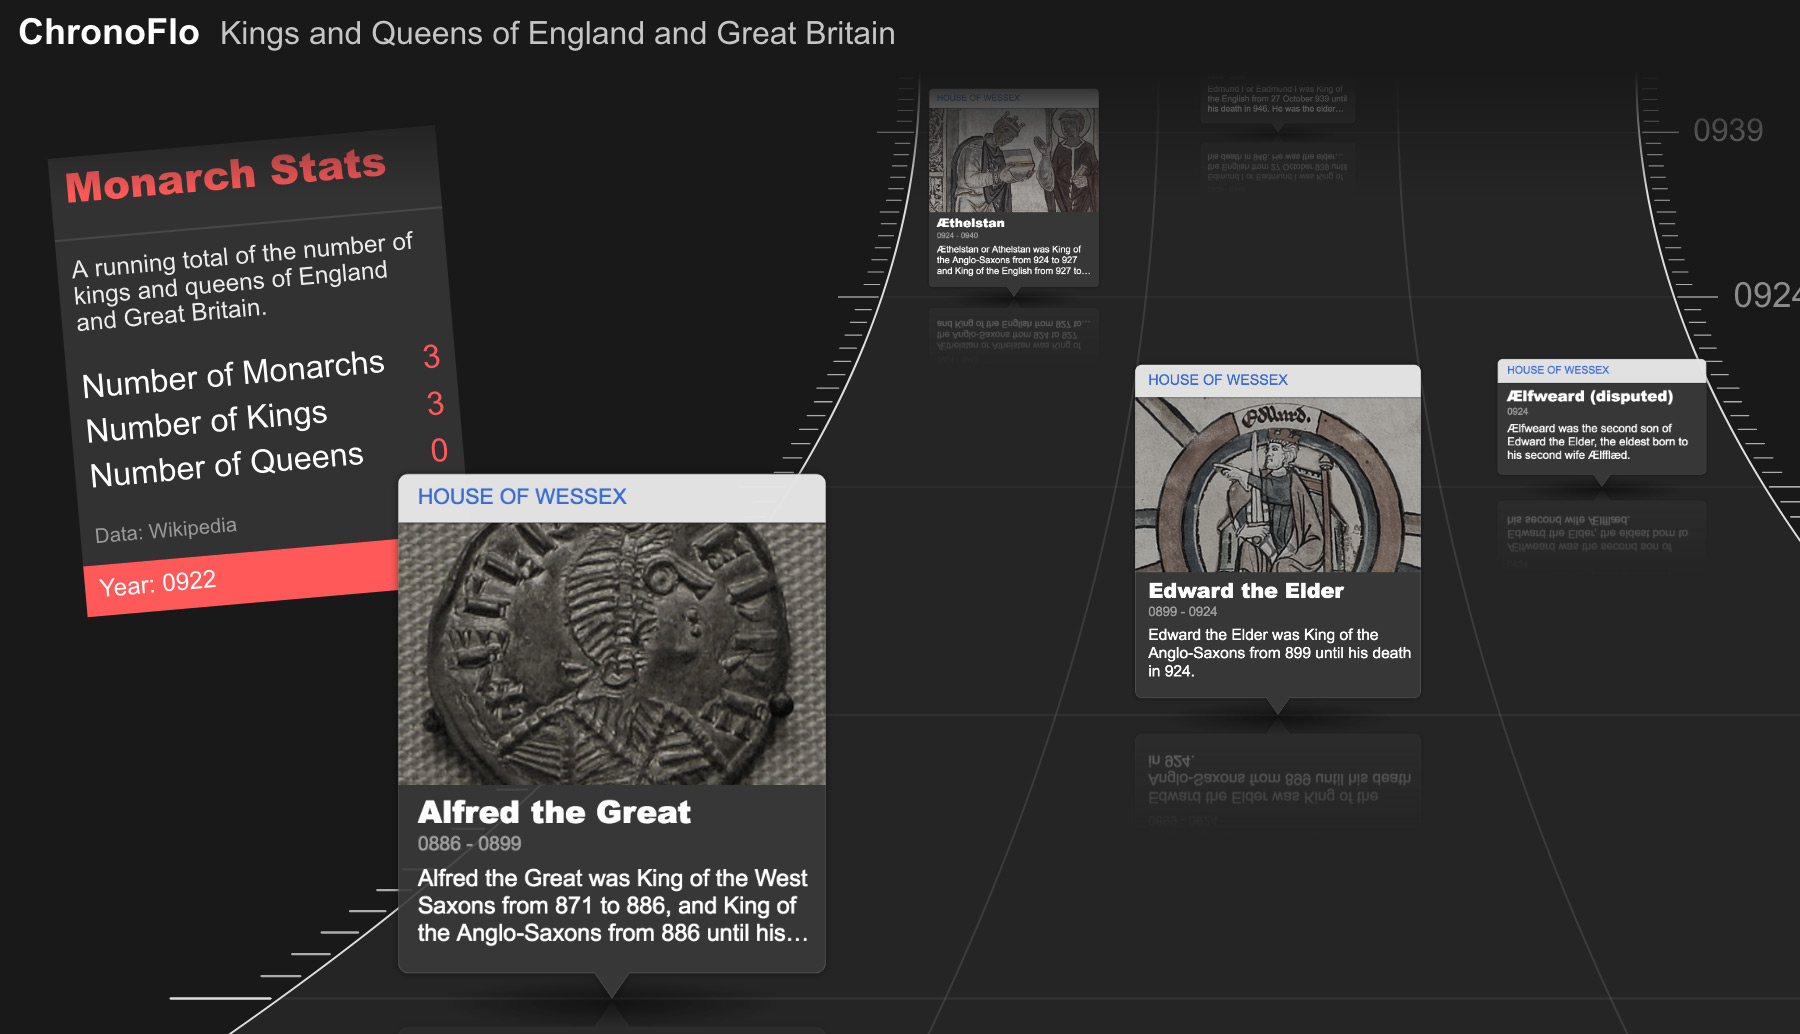
A good example of this is the British Kings and Queens timeline, where a simple table tracks how many monarchs, kings and queens there have been at different moments in history. It’s subtle, but powerful: instead of reading a static list, you see history accumulating.
In this post, we’ll walk through how to recreate that effect in your own timeline by combining two features—Spatials and Graphs.
Adding a table to your timeline
The first step is to create what ChronoFlo calls a Spatial. Spatials let you place visual elements directly onto your timeline canvas—text, icons, tags, and in this case, a table that can change over time.
Head to the “More Options” tab and select the Spatial data option. Create a new spatial, give it a name, and set its design to “Table.” Once added, you’ll be able to click anywhere on your timeline to position it exactly where you want it to appear.
The key step here is defining the structure of your table. In the text field, enter the labels for each column, separated by a vertical bar (|). For the monarch example, we used:
Number of Monarchs|Number of Kings|Number of Queens
This defines what your table will display—but not yet how it changes. Save the spatial and return to the main interface.
Bringing the table to life with data
To make the table dynamic, you now need to create a graph that feeds it values over time.
Again from the “More Options” tab, select the graph option and create a new graph. The name you give this graph is important—it must exactly match the name of the spatial you just created. This is how ChronoFlo links the data to the visual table.
Set the graph type to “Spatial Data,” and then enter your data in the format:
date=value1|value2|value3
Each row represents a point in time, and each value corresponds to one of the columns you defined earlier. For example:
0200BC-01-01=0|0|0
0886-01-01=0|6|5
1345-01-01=2|8|7
1945-01-01=5|10|13
As your timeline progresses, the table will update to reflect these values, creating a live sense of accumulation or change.
A different way of telling time
What makes this feature interesting isn’t just the mechanics—it’s what it enables. Instead of simply marking events, you can show trends, growth, decline, or comparisons alongside your narrative.
Whether you’re tracking population, economic data, scientific discoveries, or something more playful, a spatial table adds another layer of meaning to your timeline. It invites viewers not just to follow events, but to notice patterns.
And often, that’s where the story really lives.